I love JetBrains’ IDEs. I’ve been a faithful user since PyCharm’s release, seven years ago.
As of late, if I’m watching a presentation, and someone is writing code in an editor, that editor is almost always VSCode.
Something’s up, and I’m going to get to the bottom of it. People rave about this thing.
I'll answer some questions for myself—and, with luck, maybe I can save the JetBrains-faithful some time and energy. I aim to discover:
- Does it support my key bindings, or will I need to relearn everything?
- What’s the analog of a “Run Configuration?”
- What’s debugging look like? How’s the source map support?
- How easy is it to configure?
- How’s the extension ecosystem?
- How does the VCS (Git) integration differ?
- What’s the story on inline errors or warnings?
- How smart is it about types and code completion?
I’ll be looking at this from the standpoint of a JavaScript developer, so I’ll write “WebStorm,” but I really mean “a JetBrains IDE.”
I’m certainly interested in how VSCode handles Python and C/C++, but I’m not going to explore it in this post.
First Impressions
I used Homebrew Cask to install it:
$ brew cask install visual-studio-code
==> Satisfying dependencies
==> Downloading https://az764295.vo.msecnd.net/stable/f88bbf9137d24d36d968ea6b2911786bfe103002/VSCode-darwin-stable.zip
==> Verifying checksum for Cask visual-studio-code
==> Installing Cask visual-studio-code
==> Moving App 'Visual Studio Code.app' to '/Users/boneskull/Applications/Visual Studio Code.app'.
==> Linking Binary 'code' to '/usr/local/bin/code'.
🍺  visual-studio-code was successfully installed!
This takes ~4s on my 2016 MBP—but I don’t have any extensions installed yet.
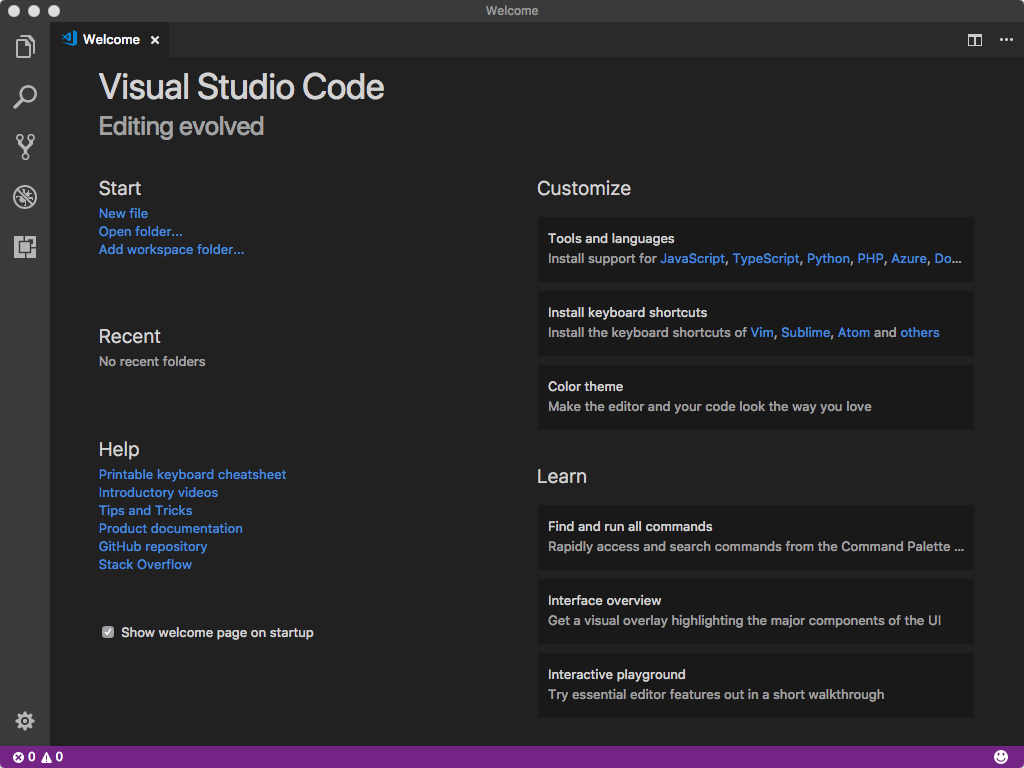
I’m greeted with this:

VSCode’s “Welcome Page”
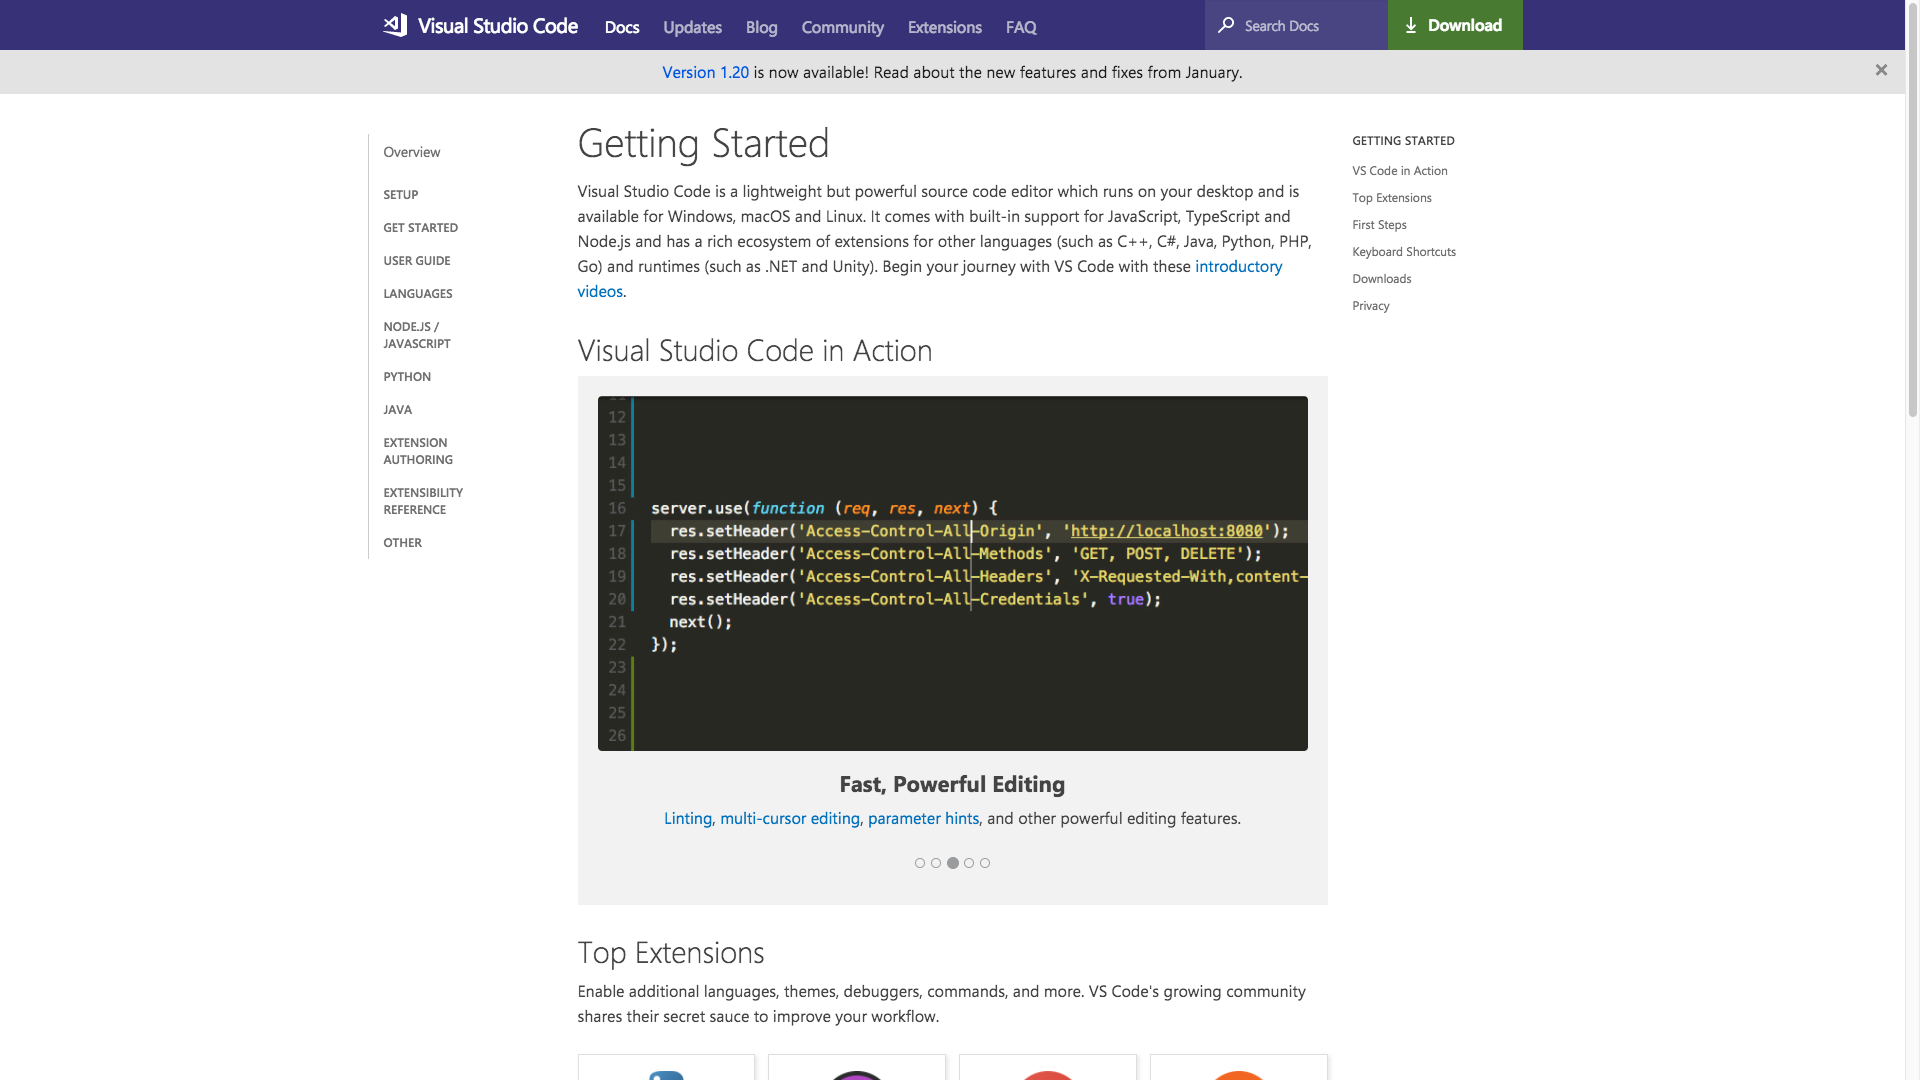
It has also opened a web page in Chrome:

Online tutorials & such for VSCode
I ignore the web page (thanks, but no thanks) and click a few of the “Install support for…” links under Tools and languages to get some basic extensions installed. I want to avoid customizing too much at the outset. Since C/C++ isn’t listed on the “Welcome Page”, I dig into to the extensions and … can’t help myself from installing a bunch of extensions. Oops.
I am, however, elated to report that the JetBrains IDE Keymap is a thing, and it works great.
I go ahead and open up my Mocha working copy…
Summary
- Install “Extension Packs” to get started quickly. You will install many extensions.
- There’s plenty of tutorials.
- If you're using the default bindings in WebStorm, you likely want to install the JetBrains IDE Keymap extension.
- Key bindings are at once more powerful and complex than WebStorm. It’s difficult to discover what a particular keystroke does at any given time, but also supports conditionals, for a nearly absurd level of control.
Close Encounters with Version Control
OK, so I want to edit Mocha’s CHANGELOG.md. But I know origin has changes I need to pull.
Happily, VSCode understands this is, in fact, a working copy. To pull, I found a little “refresh” button in my status bar, and clicked it. I think it worked? It said "sync." What's a "sync"?
I’m unsure what just happened. Which changesets did Git pull? I want to look at the history. After searching in vain, I realize that there is no built-in support for Git history, and I’m going to need to grab an extension for this.
GitLens seems to solve this problem (and others). But there are many Git-related extensions for VSCode. This is a drawback of the “small core” philosophy of VSCode (this reminds me of the Node.js ecosystem). To VSCode’s credit, it aids discovery with tags, filters and sorting.
GitLens does some oddball things like “inline blame” and “code lens” (which is another view into “blame”? I don’t get it). I want to turn this noisy stuff off.
Hint: run GitLens: Toggle Code Lens and GitLens: Toggle Line Blame Annotations from the Command Palette.
GitLens then provides Git history in the left sidebar. The presentation of the repo is a little disorienting (there are so many trees, it's like a forest), but I do see the pulled changesets.
Whew.
I’ve made my changes to CHANGELOG.md, and it’s time to commit. VSCode helpfully marks the file with a big M in the file list. +1.
I find Git: Commit via the Command Palette, and realize I could have used my trusty ⌘-K. But I’m prompted that the stage is empty.
If you only use WebStorm’s built-in version control client (I don't), this will be culture shock. VSCode uses the stage, like literally every other Git client except WebStorm’s.
I go ahead and commit everything (including unstaged changes; this would be Git: Commit All if I wanted to avoid the prompt), and push.
Not the nicest initial experience, but I’m confident it’ll be smoother sailing from here.
Next, I’ll run Mocha’s test suites to prepare for publishing.
Summary
- You will likely want to install the Git extension pack, due to VSCode’s basic client implementation.
- VSCode uses the stage, unlike WebStorm.
- VSCode automatically enables Git support for working copies instead of prompting you into oblivion.
Tasks in VSCode
I think a “Task” is perhaps a “Run Configuration” or “External Tool”.
“Tasks” are not the same as “Tasks” in a WebStorm, which is WebStorm’s (leaky) abstraction around issues, staged changes and branching.
Let’s see what “Configure Tasks” does…
 What's do you call a widget like this, anyway?
Ooook. that needs some further explanation, but sure. Is it trying to automatically detect my npm scripts? For reference, Mocha’s scripts in its package.json is literally just:
{
  "scripts": {
    "prepublishOnly": "nps test clean build",
    "start": "nps",
    "test": "nps test"
  }
}
I’ll roll the dice with npm: test.
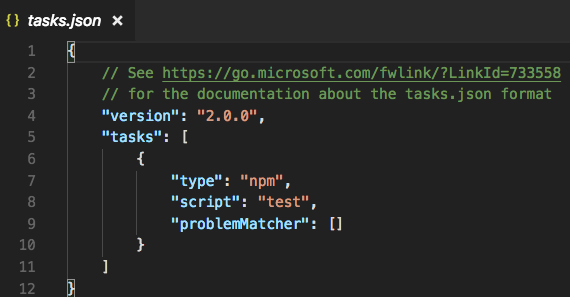
VSCode creates and opens a .vscode/tasks.json file:
 At least it's not XML, amirite?
Fascinating. I click the link and learn about this file. It’s unclear whether VSCode intends for the user to commit .vscode/ to VCS (I don’t do so; in fact, I add .vscode/ to my .gitignore post-haste).
VSCode likely didn’t need me to “configure” the Task—it discovered the script itself. I execute Run Task…, choose npm: test, and the output opens in a terminal, as you’d expect.
I’m now certain “Tasks” are analogous to “External Tools”. Like in WebStorm, the user (seemingly) cannot debug a Task, and there’s little integration. VSCode ships with some helpers for common build tools (unfortunately, nps is not one of them). Like WebStorm, the user has free rein to create a “shell”-based Task.
I’m still looking for the analog of a “Run Configuration,” which appears to be a “Debug Configuration,” though it’s just called “Configuration” under VSCode’s “Debug” menu. Next, I’ll take it for a test-drive. Whatever the hell it’s called.
Summary
- “Tasks” in VSCode are analogous to WebStorm’s “External Tools”.
- Configure tasks via JSON files. This isn’t too awesome, but VSCode provides validation/completion when editing, which is better than nothing.
- You must choose whether or not to commit
.vscode/to VCS. I’ve never had success committing any sliver of.idea/to VCS, but maybe the story is different here. Don’t look at me; find some other guinea pig.
Trivia: VSCode recognizes the filetype of
tasks.jsonas “JSON with Comments”, which, AFAIK, is unadulterated, imaginary nonsense. Is it JSON5 or not?
Debugging
Photo by Mink Mingle / Unsplash
First, I install the Node.js Extension Pack, since I figure I’ll need it to debug properly.
From VSCode’s menu, I open Debug > Open Configurations. I’m presented with a new file, .vscode/launch.json. Like tasks.json, this is my config file.
This menu item inexplicably corresponds to the command
Debug: Open launch.json.
In Node.js
Do you want the good news or bad news first? I don't care.
The bad news is, I can’t just throw npm test in launch.json and expect my breakpoints to get hit. Why not? Because npm spawns nps, which spawns ten different mocha processes in series, each which spawn _mocha, and many of which spawn _mocha again.
This is by no means VSCode's fault, but the story around debugging subprocesses in Node.js is a sad one. I'd be foolish to expect a miracle.
The good news is that if I choose some subset of the tests to run with bin/_mocha, debugging works well (unless I want to debug more child processes). It’s a solid debugging experience, though lacking some of the bells & whistles of WebStorm’s debugger.
In a Browser
Debugging tests with Karma, awkward is.
In a WebStorm, you create Karma-based run configuration, point it to your config file, specify any particular browsers or other extra options, and push the button. It works well, even if you happen to be bundling your code with karma-browserify, which Mocha is.
This is the VSCode experience:
- You need to install the Chrome Debugger extension.
- Create a
chromedebug configuration identical to:
{
  "type": "chrome",
  "request": "attach",
  "name": "Attach to Karma",
  "address": "localhost",
  "port": 9333,
  "pathMapping": {
    "/": "${workspaceRoot}/",
    "/base/": "${workspaceRoot}/"
  }
}
- Modify your
karma.conf.js(ugh, really?) to add a custom launcher to your setup object. The port below must be the same port as above. Hope it’s not in use!
{
  customLaunchers: {
    ChromeDebug: {
     base: 'Chrome',
      flags: ['--remote-debugging-port=9333']
    }
  }
}
- Start Karma (you can create a Task to do this):
karma start —-browsers ChromeDebug --auto-watch --no-single-run. Leave it running. - Run your “Attach to Karma” debug configuration; choose it from “Debug” > “Run Configuration…”.
At this point, you can set breakpoint(s) by clicking in the editor’s gutter, though they will not immediately be enabled.
There appears a small, odd, quasi-movable toolbar near the top of the window. Within this impish toolbar is a “refresh”-looking button; click it to re-run the tests. VSCode will then be able to discover which scripts/files Karma loaded. If you’re lucky, it’ll even hit your breakpoint!
The above took a solid hour to figure out, even with a few scattered examples out there.
The last thing I want to evaluate is VSCode’s “IntelliSense” capabilities.
Summary
- “Run Configurations” = “Debug Configurations”. I’m calling them “Debug Configurations”, so there.
- Configure “Debug Configurations” via JSON, like “Tasks”.
- VSCode has very basic breakpoints without support for features such as enabling/disabling based on previous breakpoints, or disabling once hit.
- Debugging in Karma is a poor experience. I couldn’t find a Karma-specific extension to help with this.
Code Completion, Inspections, & Intentions (Oh My)
Assuming you use ESLint, install the ESLint extension.
In terms of inspections, I just want ESLint to run on my JavaScript. I don’t need any other inspections, so I disable all the random crap WebStorm ships with.
The ESLint extension “just works,” and the user sees the same type of inline inspections as from ESLint within WebStorm, right down to the intentions, like “Fix file with ESLint”.
The Node.js Extension Pack provides some npm-related "IntelliSense," which knows important stuff about package.json, like if a package is missing or extraneous, will tell you so, and automatically fix it for you via an intention.
Is “IntelliSense” a trademark or something? It’s a Microsoft-ism, right? I am pretty sure I hate this word.
I believe VSCode uses TypeScript definitions under the hood (not just in TypeScript files) to inspect code, at least in part. This results in extremely accurate and nearly instantaneous code completion, jump-to-declaration, and the like. If there’s any “killer feature” for JavaScript developers, it’s this. You can coax such behavior out of WebStorm, but it will still be much more sluggish.
A “deep dive” into this would be an excellent source of information for WebStorm users (think: CSS, HTML, TypeScript, template languages, etc.), but is unfortunately out-of-scope. I’ll end with my final thoughts below.
Summary
- VSCode (and/or its extensions) provide accurate, zippy code-completion and inline docs for JavaScript.
- VSCode does not ship with a bunch of built-in inspections. If you use them, you’ll miss them, unless you find alternatives.
- The ESLint experience is strong.
- The npm-related experience is excellent.
VSCode: The Verdict
Photo by chuttersnap / Unsplash
Visual Studio Code is better than I expected. It’s comparable with WebStorm—by way of extensions—in terms of feature set. It has a couple notable advantages over WebStorm, however:
- VSCode is generally faster and more responsive than WebStorm
- VSCode’s JavaScript inspection/completion experience is just plain better
- Free as in beer
- Much exciting!
Notable disadvantages include:
- Poor browser-based debugging experience (for me, anyway)
- Piecemeal (though complete) Git support
- JSON-based configuration
- No customer support
As a developer, my code editor my most important tool. Having spent many years with JetBrains and WebStorm—and having very little dissatisfaction—a different tool must be incredibly compelling for me to want to pick up.
My advice for WebStorm users? Don’t try VSCode unless you are prepared to switch.


